Statistics
In order to offer a deeper and more detailed view of Oceania, we attach some UN ESCAP Pacific subregion statistics that provide diverse data of the region. We should recall that "Oceania" is not regarded as a region by the ESCAP; however the ESCAP does have a Subregional Office for the Pacific, which covers Fiji, Kiribati, Marshall Islands, Micronesia (Federated States of), Nauru, Palau, Papua New Guinea, Samoa, Solomon Islands, Tonga, Tuvalu and Vanuatu, as well as American Samoa, the Cook Islands, French Polynesia, Guam, New Caledonia, Niue and the Northern Mariana Islands as associate members. All graphs are provided by the ESCAP Statistical Online database. For specific statistics of each of the 11 Pacific Islands, check the World Bank’s site.

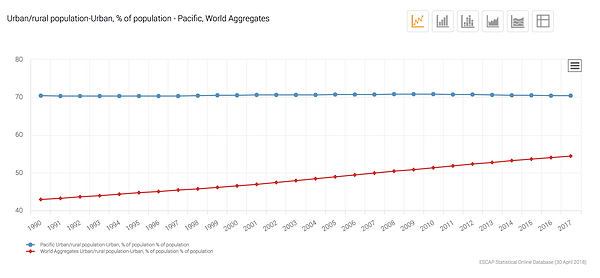
Demographics
Urban population (% of total population) in the Pacific (blue) and in the world (red)
Pacific net migration (per 1000 population)

Pacific crude birth rate (per 1000 population)

Pacific crude death rate (per 1000 population)

Crude death rate (per 1000 population) in the Pacific (blue) and in the world (red)
Health and poverty

Pacific government health expenditure (% of government expenditure)
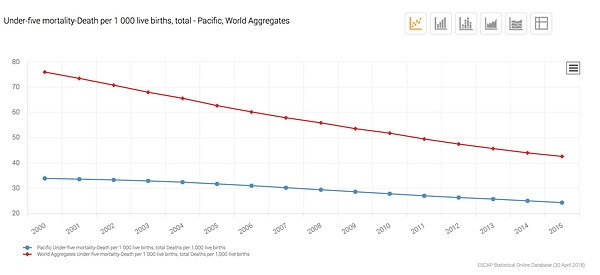
Under-five mortality (death per 1000 live births) in the Pacific (blue) and in the world (red)
HIV new infections rate in the Pacific (blue) and in the world (red)

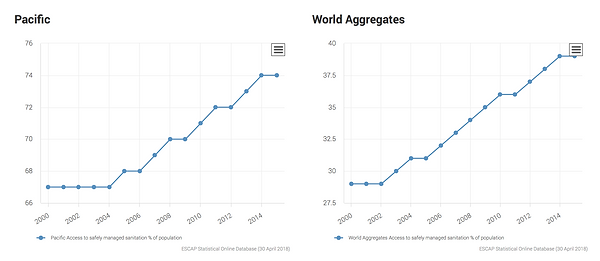
Access to safely managed sanitation (% of population) in the Pacific (left) and in the world (right)
Economy

Pacific GDP (2010 USD) - Imports

Pacific GDP (2010 USD) - Exports

Pacific GDP 2010 USD (left); World GDP 2010 USD (right)


Employment in agriculture (% of employment) in the Pacific (blue) and in the world (red)
Pacific tourism arrivals (thousands of people)
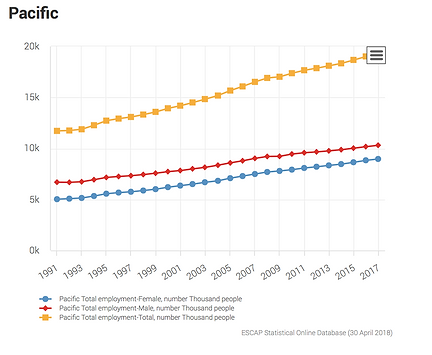

Pacific total employment (thousands of people) - Female numbers (blue), male numbers (red), total numbers (yellow)
Pacific R&D expenditure (% of GDP)
Disaster
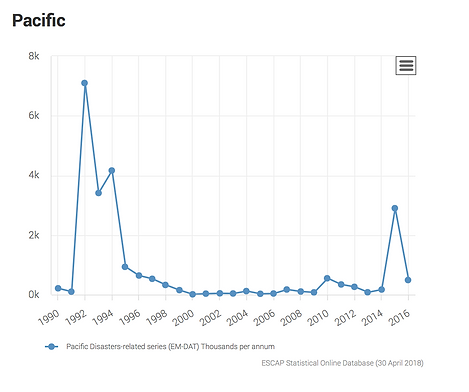
Pacific people affected by disasters (thousands per annum)
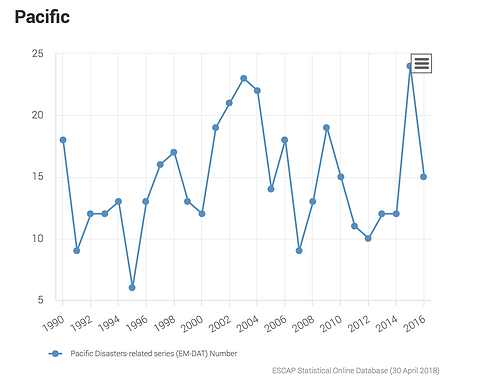
Disasters in the Pacific (number of events)

2016 direct disaster economic loss (% of GDP per 1000 USD) in the Pacific (blue) and in the world (red)
Environment

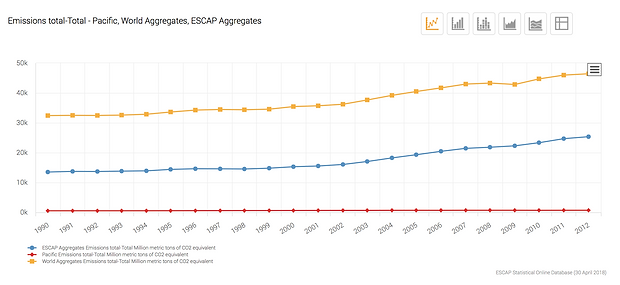
Greenhouse gas emissions (million metric tons of CO2 equivalent) in the Pacific (red), in the ESCAP region (blue) and in the world (yellow)
CO2 emissions (thousands tons of CO2) in the Pacific (red), in the ESCAP region (blue) and in the world (yellow)
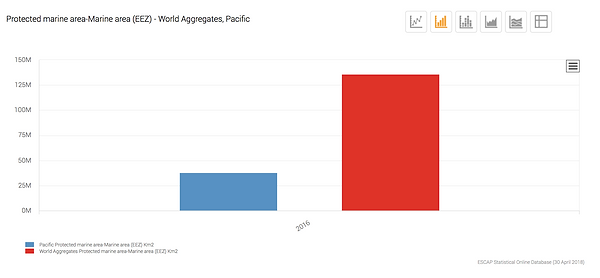
Protected marine area (km2) in the Pacific (blue) and in the world (red)
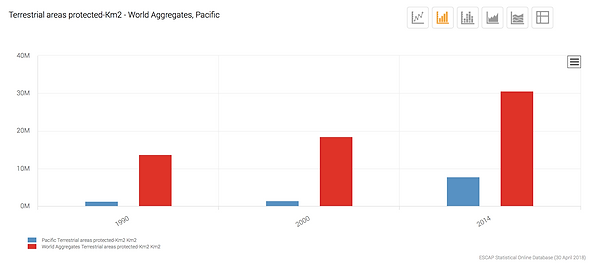
Protected terrestrial area (km2) in the Pacific (blue) and in the world (red)

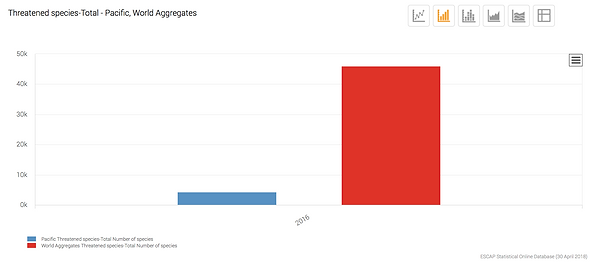
Threatened species (number of species) in the Pacific (blue) and in the world (red)
Pacific forest area (km2)
Energy and natural resources


Pacific reliance on clean fuels and technology (% of population)
Reliance on clean fuels and technology (usage rate, % of population) in the Pacific (red) and in the whole ESCAP region (blue)
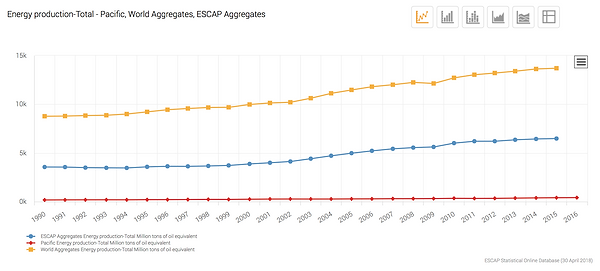
Energy production (million tons of oil equivalent) in the Pacific (red), in the ESCAP region (blue) and in the world (yellow)

Material footprint (total million tons) in the Pacific (blue) and in the world (red)
A gender perspective
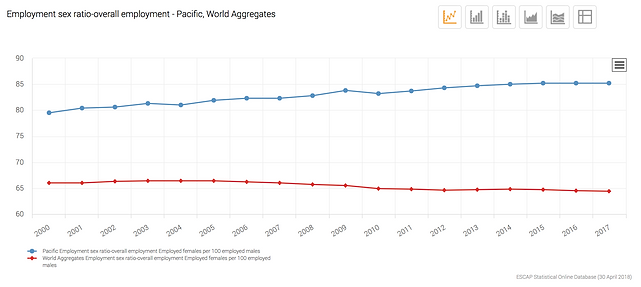
Employment sex ratio (number of employed females per 100 employed males) in the Pacific (blue) and in the world (red)

Women in parliament (% of seats) in the Pacific (blue) and in the world)